Liav:
My suggestion is in the spirit of ILD but
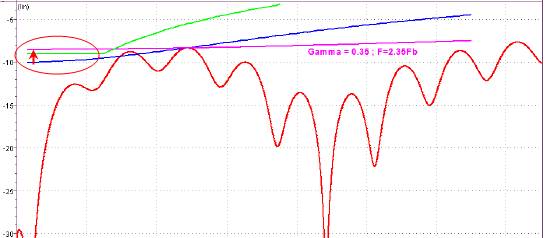
also includes Return Loss. The present channel model approximation is based on
the transmission loss model modified to include resonance effects through the
use of the ILD limits. The same could be done for Return Loss. The
derivation of ILD is such that the detailed local frequency behavior is suppressed
and doesn’t take into account holes or suck-outs (I hate that term). Theoretically,
if we had a channel model that represents higher order frequency dependencies such
as a pole-zero approximation with exponential transmission line characteristics,
then we could account for resonances explicitly. Unfortunately, pole-zero approximations
are not easily derived are sometimes unstable and although some tools do it, I
am of the mind that we should stay tool agnostic.
This is why I am discussing a simpler
algorithm that takes into account local frequency behavior approach. Find
the successive peaks and valleys, note the peak/valley frequencies, find the
average Insertion Loss and/or Return Loss between the frequencies and compute
the ratio of average vs. peak-to-peak. From a limit table, decide if the
interconnect is OK.
ed
Dr. Edward P. Sayre, P. E.
North East Systems Asscoiates, Inc.
[T]: +1-781-837-9088
[C]: +1-978-314-4940
[E]: esayre@xxxxxxxx
From:
Sent: Wednesday, October 17, 2012
1:59 PM
To:
Subject: RE: [802.3_100GCU] Return
loss waveform at TP0a and TP5a
Hi Ed,
If I understand your suggestion correctly,
I find this suggestion very interesting.
This correlates somewhat to fitted and ILD characteristics...
The waviness is board test fixture induced. limiting this can also help one know that the measurement is good enough...
However,
To contradict everything I wrote above, I think that the need for such a definition should take into account that:
1. the amount of board fixture ILD is limited in the spec.
2. if a device passes the measurement with higher board induced waviness, the device, to my understanding, is only better. connected to a better fixture it would pass with higher margin.
What do you say?...
thank you,
Best Regards,
Liav
Sent from my mobile phone
Liav:
I am concerned at the extent of the peak
to valley variations seen in the Return Loss characteristics below. I
think that a peak-to-peak vs. local average value might be a good metric.to
include. I will work up a couple of test cases to get some numbers.
ed
Dr. Edward P. Sayre, P. E.
North East Systems Asscoiates, Inc.
[T]: +1-781-837-9088
[C]: +1-978-314-4940
[E]: esayre@xxxxxxxx
From:
Sent: Wednesday, October 17, 2012
12:15 PM
To:
STDS-802-3-100GCU@xxxxxxxxxxxxxxxxx
Subject: [802.3_100GCU] Return
loss waveform at TP0a and TP5a
Hi
All,
During
the
93.8.1.4 Transmitter output return loss
93.8.2.2 Receiver input return loss
94.3.12.4 Transmitter output return loss
94.3.13.2 Receiver input return loss
This
specification was intended to correlate to the package return loss as specified
for COM @TP0 and TP5. These are specified in:
Table 93–8—Channel operating margin parameters
Table 94–17—Channel operating margin parameters
A
concern was brought up that the extrapolation of the package return loss values
from the device pins to TP0a and TP5a:
1.
took into account the extra waviness of the return
loss.
But:
2.
Gave extra non relevant margin to the low frequency
return loss

I
find this concern very reasonable and therefore suggest to fix the limit at
TP0a and TP5a to take into account that the test fixture has very minimal loss
@ low frequencies.
The
way I suggest doing that is by defining the following two sections of return
loss:
RL(f)
≥ 6.25*f+10.3125 ; 0.05<f<3 ; f in GHz


I
will be referencing this E-mail in the suggestion resolution to the comment I
will be submitting.
Inputs
are welcome (let’s have the debate here and save the time in Tx J).
Best
regards,
--Liav