Hi George,
Thank you for pointing out this. The difference between AFEXT is due to the insertion loss scaling. I forgot to change the insertion loss scaling of 0.1 (used for 10BASE-T1L 1km
IL) to 0.2 (100BASE-T1L 500m IL).
With corrected IL scaling factor of 0.2 for only 100m 100BASE-T1L disturbers, AFEXT and TX PSD are the same as yours, and AWGN level achieved by averaging the total AXT PSD over
60MHz is -112.22dBm/Hz without PSANEXT taken into account, about 0.8dB difference with regard to -113dBm/Hz. With PSANEXT taken into account, it increases to -111.76dBm/Hz. The detailed results have been attached.
4B3T PAM3 and 8B10B PAM4 are considered in my simulation to have a quick comparison with Brian’s work, where 4B3T PAM3 and 5B3Q PAM4 are used at different symbol rates. More details
of the time-domain simulation have been presented in the attachment.
Best wishes,
Tingting
发件人: George Zimmerman <george@xxxxxxxxxxxxxxxxxxxx>
发送时间: 2024年3月6日
23:52
收件人: zhangtingting (O) <00001e92abc91102-dmarc-request@xxxxxxxxxxxxxxxxx>; STDS-802-3-SPEP2P@xxxxxxxxxxxxxxxxx
主题: RE: modeling of noise
Tingting – thank you for checking – I think on my presentation you may have been looking at the “a” version, which was corrected for erroneous figures – See the “b” version - on page
12, the “b” version (most recent) has the -113 below the left hand side (100BASE-T1L PSAFEXT only) figure, and a combined source under the 10/100 mixed crosstalk case.
I posted the excel file which calculates the Alien crosstalk cases on the website. You can check that.
Spot checking your AFEXT graphs, the difference seems to be in the AFEXT curve itself. I’m wonderng what you used for Looking at the point for 60 MHz (I checked a few others, the divergence
is pretty big but this is sufficient) I would get:
PSAFEXT = PSAACRF(40 MHz) + IL_100(40 MHz)
IL_100(40 MHz) =
PSAACR-F (f) is as below, with N=2, as you point out:
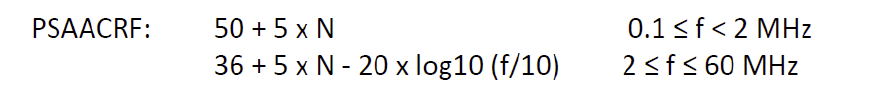
At 60 MHz with N=2, this is 46 – 20log10(6) = 30.44 dB
IL(f) is as below, for a 500m line:
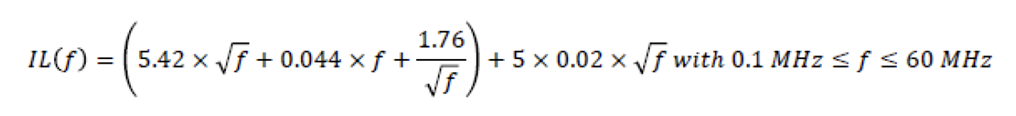
At 60 MHz this evaluates to 45.62 dB, If we scale this for a 100m disturber line rather than 500m, we get: 9.12 dB
So, putting these together, I would get a PSAFEXT loss at 60 MHz of 39.56 dB
The ANEXT loss is much greater than this… at around 48 dB… so it doesn’t impact the AXT level – we agree on this.
>>> This appears to be the different, and is significantly less than the level of (about 34 dB) on your left-hand plot of Alien crosstalk coupling functions on your slide 1.
>> I note that the plot of AFEXT coupling on slide 2 looks approximately correct at about 76 dB loss, when the insertion loss is not scaled.
>> for spot checking, at 40 MHz, I would have 41.3 dB AFEXT loss, to your 38 dB, and at 20 Mhz, it would be 45 dB to your about 43 dB, so the difference grows with frequency
>> as the frequency drops, the curves get closer – your 10 MHz value of 47 dB loss is closer to mine of 49.7 dB, and at 2 Mhz, where the curve shape changes, I have 61.8 dB AFEXT loss.
I’m wondering whether you scaled the fext as 20 log10(f/10) or inadvertantly used the NEXT scaling on it (15 log (f/10))?
I hope this helps.
For completeness,
The PSD level at 60 MHz for 75 Mbaud is about -72.6 dBm/Hz. – we agree on this.
The resulting AFEXT level would be –(72.6 + 39.56) = -112.16 dBm/Hz, which looks about 4 dB lower noise than you have in your curve on the right on page 1.
As far as the difference in simulation SNRs is concerned, I think you’ll have to provide more information on your setup. The label appears incorrect, as you can’t have 8B10B or 4B3T
encoding and yet vary the baud rate and still carry 100 Mb/s.
-george
From:
stds-802-3-spep2p@xxxxxxxxxxxxxxxxx <stds-802-3-spep2p@xxxxxxxxxxxxxxxxx>
On Behalf Of zhangtingting (O)
Sent: Tuesday, March 5, 2024 11:31 PM
To: STDS-802-3-SPEP2P@xxxxxxxxxxxxxxxxx
Subject: 答复: modeling of noise
Hi George,
Thank you for your kind elaboration. Initially, I was confused with the left figure on Page 12 in your presentation. The
“-113-10log10(fbaud/75)” is written below the figure titled
“Mixed 100m 100BASE-T1L PSAFEXT and (100m) 100BASE-T1L PSAFEXT”. Therefore, I thought the suggested AWGN level was derived from the mixed crosstalk case. I follow the methods that you used and the calculated
AWGN level for only 100BASE-T1L is -109 dBm/Hz, which is 4dB higher. The results are presented in the attachment.
Brian,
Using AWGN level (-113-10*log10(fbaud/75)) and 500m dg IL model, I have achieved similar SNR as you for 66.66MBd and 75MBaud PAM3, but the SNR for PAM4 is much better (Please see
Page 5 of the attached PPT). In the case of the same symbol rate, Vpp, and AWGN level, SNR difference between PAM3 and PAM4 is expected be close to the PAPR difference of ~0.8dB, isn’t
it?
Current simulations are all based on AWGN without impulse noise impact taken into account. If anyone can provide the impulse noise, we can try to include that in our simulation
and then see the impacts.
Thank you all.
Best wishes,
Tingting
发件人: George Zimmerman <george@xxxxxxxxxxxxxxxxxxxx>
发送时间: 2024年3月5日
23:47
收件人: STDS-802-3-SPEP2P@xxxxxxxxxxxxxxxxx
主题: [802.3_SPEP2P] modeling of noise
All –
I wanted to update you on some offline questions and answers I’ve been having with Tingting on modeling of noise.
I will remind you that we chose to use an additive white gaussian noise model for the noise, and we have had discussion about adding impulse noise to this. As I have said before, for building consensus, showing common
models, or showing common models as well as relationships to other models, is going to make it clearer for the group to compare results.
As I have explained to the group, there are a large number of ways to model noise – none are necessarily more ‘accurate’ than others – they represent different cases and characteristics. The model being used has been
substantially simplified for the purposes of repeatability. AWGN models for these types of channels are rarely, fully accurate, but are useful proxies in comparison. We could use various scalings of PSD level, changes in the spectral shape of the underlying
noise, and changing of the rolloff of the disturbing source, averaging bandwidth of the noise, linear averaging vs. geometric (dB) averaging of the noise to produce levels for simplified sources, and passing PSDs of the noise, and even actual signals through
modelled or measured coupling functions. All of these have merit – none are necessarily more “accurate” as the actual noise will vary from scenario to scenario. Simply put, noise in these physical systems is not terribly repeatable. In my experience, variations
of SNR are not uncommon up to 2 dB. Usually the crosstalk noise levels observed are better (less) than would be obtained from our ANEXT & AFEXT coupling limits – for several reasons – including that we generally pick our limits biased towards worst-case,
not ‘typical’ case, and the limit line approach would be touched at a single frequency, generally not met across the frequency band.
In the modeling that I presented, I used the 100BASE-T1L AFEXT-only case– not the mixed crosstalk case which I also described, as we discussed. In this case you don’t add in 10BASE-T1L and you do not decrease the disturber
PSD by 3 dB. AND, the disturber is only attenuated by a short (100m) line. The total power is averaged linearly over a 60 MHz bandwidth. This result is approximated by a -113 dBm/Hz AWGN source for a 75 Mbaud signal with a scaled version of the 10BASE-T1L
frequency mask. To represent the higher in-band PSD seen with lower baud signals (and lower with higher baud), I have recommended a simple adjustment of 10log10(fbaud/75).
Because this adjustment is a simple dB shift, and is small, it can be left out of simulations – it is, in my opinion, fairly easy for individual experts to apply the correction to the results themselves. I notice that
the results presented by Brian Murray at the last meeting used a constant level (7Vrms = -113 dBm/Hz) noise source.
There are many ways to ‘improve’ this model – those that result in small shifts, can be treated similarly, those that use spectrally shaped noise are harder to compare and would need to be presented and justified. Simple
shifts include averaging over different bandwidths, varying the bandwidth that the noise is averaged, or varying the power level. Generally, varying the out of band rolloff (for 100BASE-T1L) shouldn’t be a substantial effect as this could (and probably should)
be excluded in an implementation by receiver filtering.
For those looking at the mixed crosstalk models, Tingting had asked about the sharp attenuation at 20 MHz for 10BASE-T1L in the figure on slide 11 of
https://www.ieee802.org/3/dg/public/May_2022/zimmerman_3dgah_01b_01292024.pdf, This is because the PSD for 10BASE-T1L is not defined beyond 20 MHz. By that point it has already rolled off below where it would be a factor in the calculation, and, real
PSDs would be far below the -70dBm/Hz level of the upper PSD mask… hence it doesn’t make sense to consider it a wideband source at that point.
Again, I would suggest you run results consistent with what others are doing/have done and anlso with what you think is right - that way we can calibrate results. If you anre going to another noise model, I would suggest
posting it to the reflector - that way we move to consensus. The actual transmit and disturber pads will be different yet, especially near the band edge and roll off region. We now have some presented results. I would suggest starting with those noise scenarios
for comparison.
I’ve been through the process of committees trying to reach consensus results and they are never perfect. Different simulation effects, different receiver models considered, different transmit psds both for disturbers
and victims, as well as external noise models tend to limit matching of results. From what I’ve seen if we get agreement and some understanding of differences within about 1db, that will be very good. Finer matching is usually not reflective of general principles,
but more about how the simulation is constructed. Matching worse than 2db (differences of more than 2db between individual presenters) is usually a suggestion that there is some factor they are not aligned on which needs to be resolved. Between 1 and 2 db
is a judgement call…. Again, these are my personal experiences having based on how this kind of work in standards group has gone in various projects both in ieee 802 and other groups (dsl from the 1990s).
As a result, starting from a common basis before making changes is important, and often the more important answers are not the absolute margins but the relative results of each evaluator.
I hope this helps you all as we move toward making some decisions in Denver.
George Zimmerman, Ph.D.
President & Principal
CME Consulting, Inc.
Experts in Advanced PHYsical Communications
310-920-3860
To unsubscribe from the STDS-802-3-SPEP2P list, click the following link:
https://listserv.ieee.org/cgi-bin/wa?SUBED1=STDS-802-3-SPEP2P&A=1
To unsubscribe from the STDS-802-3-SPEP2P list, click the following link:
https://listserv.ieee.org/cgi-bin/wa?SUBED1=STDS-802-3-SPEP2P&A=1
To unsubscribe from the STDS-802-3-SPEP2P list, click the following link: https://listserv.ieee.org/cgi-bin/wa?SUBED1=STDS-802-3-SPEP2P&A=1