Hi Hansel
I welcome comparing results that you are getting with your code versus what I get with mine, and I also would like to see how you incorporated the Table 180-16 constraints. I have not yet added the constrained optimization to my code.
When you say “I suspect there may be a problem with your Matlab code” I am not sure what you are referring to, as I have not provided any MATLAB code yet. Are you referring to the histograms and CDFs I showed in my presentation? Those were contrived examples based on Gaussian noise added to the nominal PAM4 values; they were not histograms from captured waveforms. I was using those simply to illustrate my points. That work was done with Mathematica, and I am confident those results are correct.
The MATLAB code I have, which I have not distributed, performs unconstrained MMSE optimization of the tap weights and is based on the contribution I referred to in my presentation, available here: https://www.ieee802.org/3/dj/public/adhoc/optics/0626_OPTX/swenson_3dj_adhoc_02_260624.pdf Did you find a problem in the algorithm described there? If so, I’d be very interested in that feedback.
I look forward to your presentation.
Regards,
Norm
From: Hansel DSilva <00004708d0869f3e-dmarc-request@xxxxxxxxxxxxxxxxx>
Sent: Wednesday, June 24, 2026 9:33 AM
To: STDS-802-3-B400G-OPTX@xxxxxxxxxxxxxxxxx
Subject: [802.3_B400G_OPTX] swenson_3dj_adhoc_01a_260624
Hi Norm,
Nice presentation! I agree with your observation that SER calculated based on your documentation is the right way!
I suspect there may be a problem with your Matlab code for I recollect getting like curvy waveforms for the Left and Right Cumulative Histograms and then fixed it, I need to go through my notes to recollect what I did.
In the upcoing Monday meeting, I will share my Maltab script in calculating TDECQ with the incorporation of the Table 180-16 constrains then we can debug the root cause for the that noisy/ curvy Cumulative Histograms in documenting the root cause.
To help validate the proposed analytical SER calculation proposed by you, compare it against the measured symbol error rate obtained directly from the equalized waveform. The measured SER can be computed by slicing the equalized samples to the nearest PAM4 level and comparing the resulting decisions with the transmitted symbols.
levels = [0.333 0.667 1.000 1.333];
decisions = arrayfun( ...
@(v)slicer_pam4(v,levels), ...
yEq);
SERmeas = mean(decisions ~= txValid);
function decision = slicer_pam4(x, levels)
[~,idx] = min(abs(levels - x));
decision = levels(idx);
end
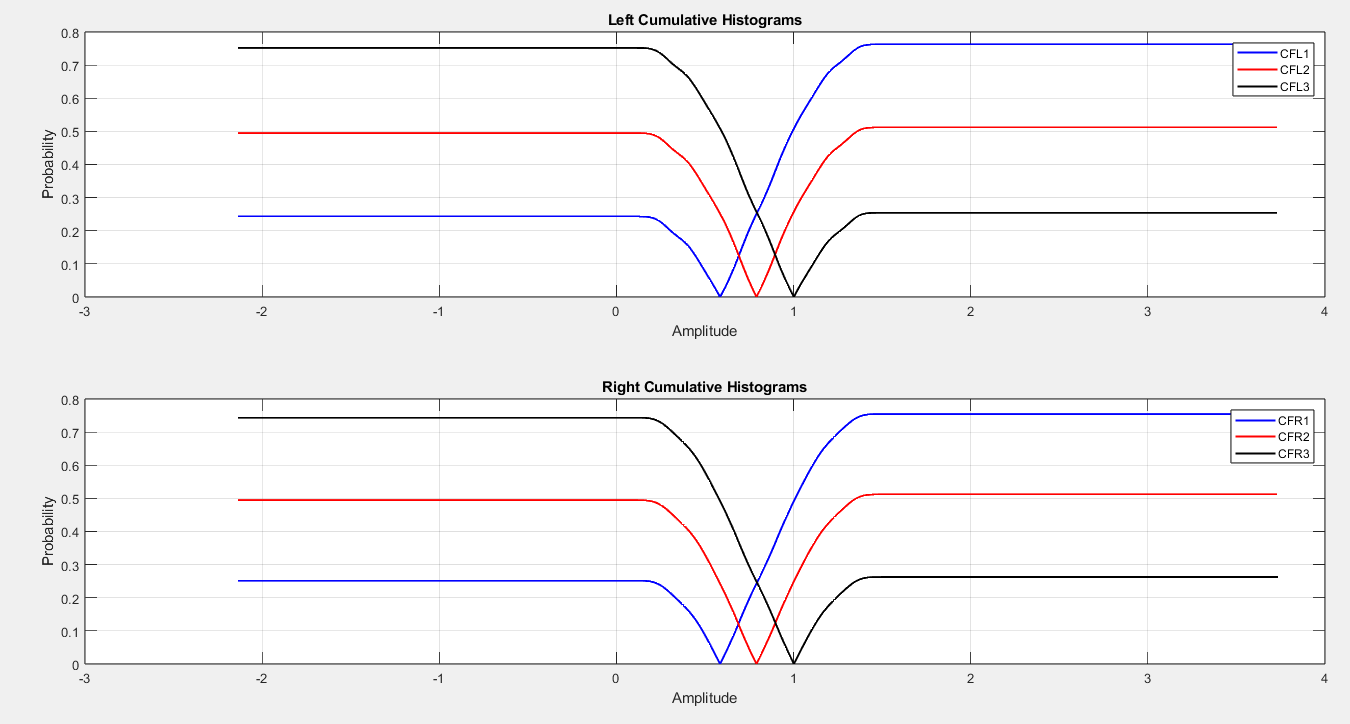
Below are a few observations for the Left and Right Cumulative Histograms.
Observation #1
- One can observe that the curve decreases toward 0 at the threshold location then increase again, forming a "V" shape.
- Essentially, computes probability mass between a bin and the threshold.
Observation #2
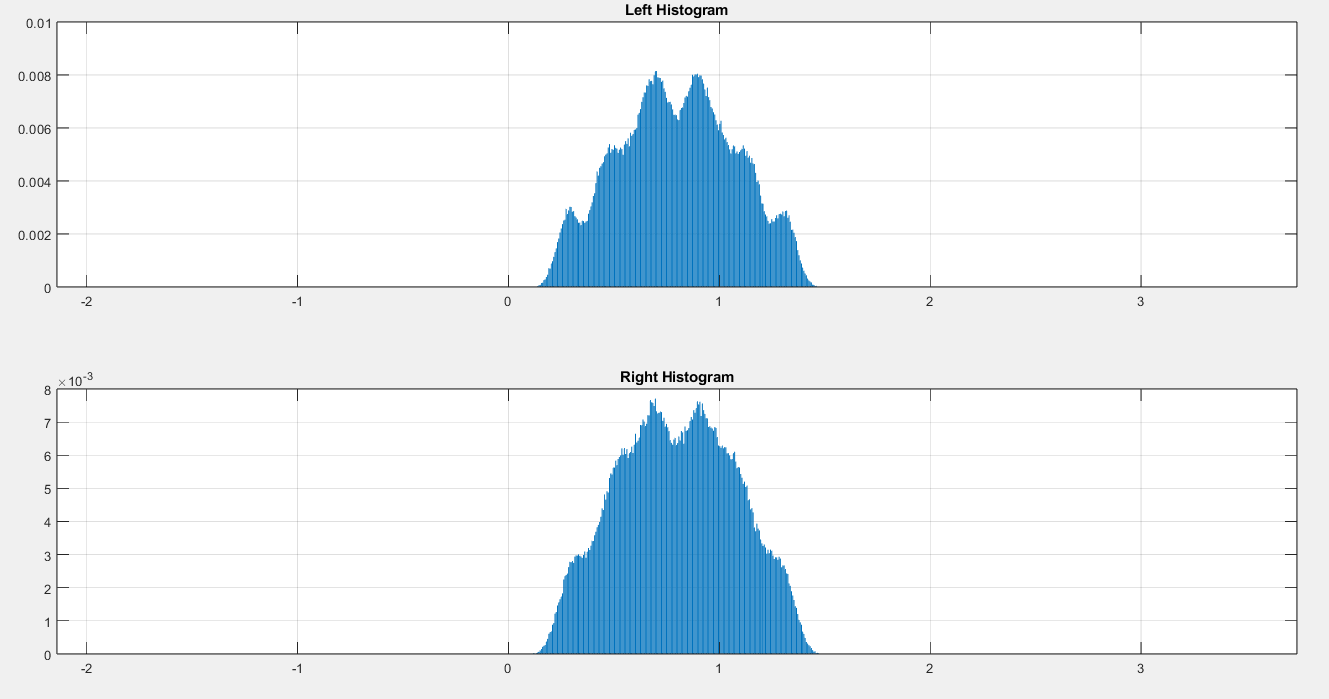
- My PAM4 levels are approximately 0.333, 0.667, 1.000 and 1.333.
- The thresholds sit near 0.56, 0.83 and 1.10.
- Consequently:
P(y< Pth1)= approx. 25%
P(y< Pth2)= approx. 50%
P(y< Pth3)= approx. 75%
This confirms where exactly the maxima are showing.
Regards,
Hansel D'Silva
Standards Development Engineer- Amphenol
To unsubscribe from the STDS-802-3-B400G-OPTX list, click the following link: https://listserv.ieee.org/cgi-bin/wa?SUBED1=STDS-802-3-B400G-OPTX&A=1
To unsubscribe from the STDS-802-3-B400G-OPTX list, click the following link: https://listserv.ieee.org/cgi-bin/wa?SUBED1=STDS-802-3-B400G-OPTX&A=1