George,
This makes sense to me.
We should the lessons learned in 2.5G/5GBASE-T and apply them to 802.3dg, even if the tools/methods are different.
Regards
Peter
_______________________________________________________________
Peter Jones Distinguished Engineer,
Cisco Networking Hardware
Chair, Ethernet Alliance
Mobile: +1 408 315 8024
Email: petejone@xxxxxxxxx
Web:
https://about.me/petergjones
Webex:
https://cisco.webex.com/meet/petejone
Book a call:
Peter's booking page
_______________________________________________________________
From: George Zimmerman <george@xxxxxxxxxxxxxxxxxxxx>
Sent: Thursday, March 7, 2024 8:05 AM
To: STDS-802-3-SPEP2P@xxxxxxxxxxxxxxxxx
Subject: Re: [802.3_SPEP2P] modeling of noise
Tingting – I’m glad to see we are close now (within a couple of dB). This should be close enough to compare results.
As mentioned, I am concerned that you are pursuing ‘false accuracy’. However, the fine adjustments hthat you are suggesting can easily be accounted for by simply adding or subtracting from the result received (because they are small).
For those who aren’t interested in why we don’t have this accuracy, or why direct linear averaging is pessimistic, you can stop reading. I believe we are now close enough and can compare at constant levels. We’ll have a more detailed
discussion when it comes to setting a level for receiver noise testing. Those interested in field testing or qualification of installed plant (and who haven’t lived through 2.5G/5G or 10GBASE-T), you may find the below interesting, and it may be useful in
future discussions. The summary is 2 to 4 dB pessimism in crosstalk noise are built into the standard modeling methodology, and the inherent variability of the environment isn’t really more accurate. I believe I mentioned this when presenting the AWGN levels,
and reiterate that we shouldn’t pretend they are accurate beyond 2 dB. In my opinion, we need repeatable results at this stage of the process so that we can compare proposals, and we need a good understanding of the additive effect of impulsive noise to aid
our line coding decisions and make selections on issues such as FEC.
-george
<discussion of noise investigations follows>
In practice, there are many factors in our modeling that introduce pessimism, which is generally greater than 2 dB, and can be more. In any case, tenths or hundredths of a dB are misleading accuracy. The AWGN model itself isn’t spectrally
right, the noise is slightly highpass, leading to a number of issues such as, the bandwidth used (60 MHz vs. Nyquist) increases the total power slightly (you can see this in the spreadsheet I provided), a DFE-based receiver will weight the noise spectrum nonlinearly,
and, in the optimum case will produce a geometric mean for noise power instead of an arithmetic mean (this can be more than 1 dB of pessimism), and of course, alien crosstalk coupling functions are limit lines and not average values (that is - a cabling system
will touch the limit line at one frequency and be lower than it at all others, an inherent pessimism).
All of these sources are introduce pessimistic bias, but more importantly, limit the accuracy needed – all that is needed is matching.
In many systems we have not pursued this accuracy because the crosstalk was either small or cancelled. There was a lot of history in crosstalk in the telephone network, and several experts brought that knowledge
forward from DSL and other technology fields into 802.3. There were operational differences in DSL in that the primary DSL technologies were variable rate and therefore somewhat more flexible on crosstalk modeling, and, of course, the cables and installation
practices were different from those in 802.3. Nevertheless, there is a lot of good crosstalk theory in the old Bell Labs work, as well as theory to understand how the nonlinear receivers serve to deal with spectral variatiton in the noise (see, e.g., the
Salz SNR computation, or various references on DMT bit allocation where the geometric mean of the noise is considered for capacity).
In 802.3, there are two specifications of note where the modeling and impact of alien crosstalk were taken to the next level: 10GBASE-T (Clause 55), and 2.5G/5GBASE-T (Clause 126). I had a major hand in the alien crosstalk specifications
for clauses 55 and 126 (126 is better, in my opinion, Mr. Diminico & I often joke about the Alien Crosstalk Margin Computation (ACMC) methodology in clause 55.7.3.3 as the ‘crazy idea’ which came out of a phone conversation we were having as I was picking
up fast-food on my way home from work late one night).
In 10GBASE-T, we reviewed rather extensively the limit line methodology, focused mostly on the fact that it was inherently overestimating the noise. I believe this was the first deep-dive into this modeling in 802.3, and the audience was
somewhat unfamiliar. If you look at the resulting spec, you will see we took a simple route and in 55.7.3, the ANEXT limit is reduced by 2.25dB and the PSAELFEXT (equivalent to PSAACR-F) , is reduced 4 dB. 55.7.3.3-T also acknowledged that that nonlinear
equalization models are used in this system and they are more forgiving than either limit lines or linear averages by introducing the ACMC.
In 2.5G/5GBASE-T, we extended the modeling in the ALSNR qualification, using template PSDs for alien crosstalk including mixed crosstalk. This allowed the cables to be qualified in-situ. It was particularly useful with category 5e cabling
where alien crosstalk is both unspecified and highly variable based on bundling, connectors, and installation. Based on the presentations we have seen, I suspect that 802.3dg will have similar variability with installation for several reasons (low numbers
of disturbers tend to make the variability higher, variation in connector architecture, and greater variation in installation practices when modular connectors are not used) to name a few reasons). Ultimately, we improved and simplified guidance for 2.5G/5GBASE-T
installations in various documents (both within 802.3, cabling standards bodies, and various whitepapers), as this was needed. Today, as 2.5GBASE-T is proliferating, I don’t see many concerned with installing 2.5GBASE-T on category 5e or 6 cabling – it seems
our analysis is holding in the field. However, despite the similarity of the underlying physics, 2.5GBASE-T is a different environment from 802.3dg, and we must respect that.
Note that I am NOT recommending that 802.3dg go down the path of this detailed level of SNR modeling, , certainly not at this time. Even though the methodology in clause 126 for ALSNR, which is similar to ACMC is better, I am also not
recommending that – they introduce operational complexity in the cable qualification. While they tend to correct the bias of limit lines and allow more installations, they are complex measurement-based methodologies which significantly increase installation
complexity. We may be able to come up with something better for the environment of 802.3dg, and if someone familiar with installation practices wants to work on this with me, let’s spend some offline time in Denver.
Ultimately,– but I raise these because they serve to point out the inherent inaccuracies (and the magnitude of them) in the process we are engaging in now.
I hope this helps the future discussion, and, like I said, find me offline and I’ll probably tell you more than you want to know about noise coupling models as they relate to PHYs…
-george
George Zimmerman, Ph.D.
President & Principal
CME Consulting, Inc.
Experts in Advanced PHYsical Communications
310-920-3860
From:
stds-802-3-spep2p@xxxxxxxxxxxxxxxxx <stds-802-3-spep2p@xxxxxxxxxxxxxxxxx>
On Behalf Of zhangtingting (O)
Sent: Wednesday, March 6, 2024 8:04 PM
To: STDS-802-3-SPEP2P@xxxxxxxxxxxxxxxxx
Subject: 答复: modeling of noise
Hi George,
Thank you for pointing out this. The difference between AFEXT is due to the insertion loss scaling. I forgot to change the insertion loss scaling of 0.1 (used
for 10BASE-T1L 1km IL) to 0.2 (100BASE-T1L 500m IL).
With corrected IL scaling factor of 0.2 for only 100m 100BASE-T1L disturbers, AFEXT and TX PSD are the same as yours, and AWGN level achieved by averaging the
total AXT PSD over 60MHz is -112.22dBm/Hz without PSANEXT taken into account, about 0.8dB difference with regard to -113dBm/Hz. With PSANEXT taken into account, it increases to -111.76dBm/Hz. The detailed results have been attached.
4B3T PAM3 and 8B10B PAM4 are considered in my simulation to have a quick comparison with Brian’s work, where 4B3T PAM3 and 5B3Q PAM4
are used at different symbol rates. More details of the time-domain simulation have been presented in the attachment.
Best wishes,
Tingting
发件人:
George Zimmerman <george@xxxxxxxxxxxxxxxxxxxx>
发送时间: 2024年3月6日 23:52
收件人: zhangtingting (O) <00001e92abc91102-dmarc-request@xxxxxxxxxxxxxxxxx>;
STDS-802-3-SPEP2P@xxxxxxxxxxxxxxxxx
主题: RE: modeling of noise
Tingting – thank you for checking – I think on my presentation you may have been looking at the “a” version, which was corrected for erroneous figures – See the “b” version - on page 12, the “b” version (most recent) has the -113 below
the left hand side (100BASE-T1L PSAFEXT only) figure, and a combined source under the 10/100 mixed crosstalk case.
I posted the excel file which calculates the Alien crosstalk cases on the website. You can check that.
Spot checking your AFEXT graphs, the difference seems to be in the AFEXT curve itself. I’m wonderng what you used for Looking at the point for 60 MHz (I checked a few others, the divergence is pretty big but this is sufficient) I would
get:
PSAFEXT = PSAACRF(40 MHz) + IL_100(40 MHz)
IL_100(40 MHz) =
PSAACR-F (f) is as below, with N=2, as you point out:
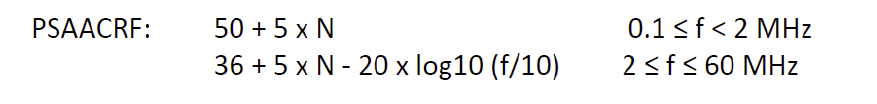
At 60 MHz with N=2, this is 46 – 20log10(6) = 30.44 dB
IL(f) is as below, for a 500m line:
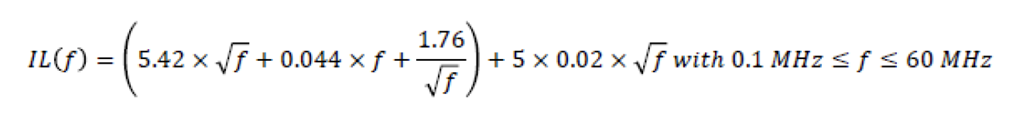
At 60 MHz this evaluates to 45.62 dB, If we scale this for a 100m disturber line rather than 500m, we get: 9.12 dB
So, putting these together, I would get a PSAFEXT loss at 60 MHz of 39.56 dB
The ANEXT loss is much greater than this… at around 48 dB… so it doesn’t impact the AXT level – we agree on this.
>>> This appears to be the different, and is significantly less than the level of (about 34 dB) on your left-hand plot of Alien crosstalk coupling functions on your slide 1.
>> I note that the plot of AFEXT coupling on slide 2 looks approximately correct at about 76 dB loss, when the insertion loss is not scaled.
>> for spot checking, at 40 MHz, I would have 41.3 dB AFEXT loss, to your 38 dB, and at 20 Mhz, it would be 45 dB to your about 43 dB, so the difference grows with frequency
>> as the frequency drops, the curves get closer – your 10 MHz value of 47 dB loss is closer to mine of 49.7 dB, and at 2 Mhz, where the curve shape changes, I have 61.8 dB AFEXT loss.
I’m wondering whether you scaled the fext as 20 log10(f/10) or inadvertantly used the NEXT scaling on it (15 log (f/10))?
I hope this helps.
For completeness,
The PSD level at 60 MHz for 75 Mbaud is about -72.6 dBm/Hz. – we agree on this.
The resulting AFEXT level would be –(72.6 + 39.56) = -112.16 dBm/Hz, which looks about 4 dB lower noise than you have in your curve on the right on page 1.
As far as the difference in simulation SNRs is concerned, I think you’ll have to provide more information on your setup. The label appears incorrect, as you can’t have 8B10B or 4B3T encoding and yet vary the baud rate and still carry 100
Mb/s.
-george
From:
stds-802-3-spep2p@xxxxxxxxxxxxxxxxx <stds-802-3-spep2p@xxxxxxxxxxxxxxxxx>
On Behalf Of zhangtingting (O)
Sent: Tuesday, March 5, 2024 11:31 PM
To: STDS-802-3-SPEP2P@xxxxxxxxxxxxxxxxx
Subject: 答复: modeling of noise
Hi George,
Thank you for your kind elaboration. Initially, I was confused with the left figure on Page 12 in your presentation. The
“-113-10log10(fbaud/75)” is written below the figure titled
“Mixed 100m 100BASE-T1L PSAFEXT and (100m) 100BASE-T1L PSAFEXT”. Therefore, I thought the suggested AWGN level was derived from the mixed crosstalk case. I follow the methods that you used and the calculated
AWGN level for only 100BASE-T1L is -109 dBm/Hz, which is 4dB higher. The results are presented in the attachment.
Brian,
Using AWGN level (-113-10*log10(fbaud/75)) and 500m dg IL model, I have achieved similar SNR as you for 66.66MBd and 75MBaud PAM3, but the SNR for PAM4 is much
better (Please see Page 5 of the attached PPT). In the case of the same symbol rate, Vpp, and AWGN level, SNR difference between PAM3 and PAM4 is expected be close to the PAPR difference of ~0.8dB, isn’t it?
Current simulations are all based on AWGN without impulse noise impact taken into account. If anyone can provide the impulse noise, we can try to include that
in our simulation and then see the impacts.
Thank you all.
Best wishes,
Tingting
发件人:
George Zimmerman <george@xxxxxxxxxxxxxxxxxxxx>
发送时间: 2024年3月5日 23:47
收件人: STDS-802-3-SPEP2P@xxxxxxxxxxxxxxxxx
主题: [802.3_SPEP2P] modeling of noise
All –
I wanted to update you on some offline questions and answers I’ve been having with Tingting on modeling of noise.
I will remind you that we chose to use an additive white gaussian noise model for the noise, and we have had discussion about adding impulse noise to this. As I have said before, for building consensus,
showing common models, or showing common models as well as relationships to other models, is going to make it clearer for the group to compare results.
As I have explained to the group, there are a large number of ways to model noise – none are necessarily more ‘accurate’ than others – they represent different cases and characteristics. The model
being used has been substantially simplified for the purposes of repeatability. AWGN models for these types of channels are rarely, fully accurate, but are useful proxies in comparison. We could use various scalings of PSD level, changes in the spectral
shape of the underlying noise, and changing of the rolloff of the disturbing source, averaging bandwidth of the noise, linear averaging vs. geometric (dB) averaging of the noise to produce levels for simplified sources, and passing PSDs of the noise, and even
actual signals through modelled or measured coupling functions. All of these have merit – none are necessarily more “accurate” as the actual noise will vary from scenario to scenario. Simply put, noise in these physical systems is not terribly repeatable.
In my experience, variations of SNR are not uncommon up to 2 dB. Usually the crosstalk noise levels observed are better (less) than would be obtained from our ANEXT & AFEXT coupling limits – for several reasons – including that we generally pick our limits
biased towards worst-case, not ‘typical’ case, and the limit line approach would be touched at a single frequency, generally not met across the frequency band.
In the modeling that I presented, I used the 100BASE-T1L AFEXT-only case– not the mixed crosstalk case which I also described, as we discussed. In this case you don’t add in 10BASE-T1L and you do
not decrease the disturber PSD by 3 dB. AND, the disturber is only attenuated by a short (100m) line. The total power is averaged linearly over a 60 MHz bandwidth. This result is approximated by a -113 dBm/Hz AWGN source for a 75 Mbaud signal with a scaled
version of the 10BASE-T1L frequency mask. To represent the higher in-band PSD seen with lower baud signals (and lower with higher baud), I have recommended a simple adjustment of 10log10(fbaud/75).
Because this adjustment is a simple dB shift, and is small, it can be left out of simulations – it is, in my opinion, fairly easy for individual experts to apply the correction to the results themselves.
I notice that the results presented by Brian Murray at the last meeting used a constant level (7Vrms = -113 dBm/Hz) noise source.
There are many ways to ‘improve’ this model – those that result in small shifts, can be treated similarly, those that use spectrally shaped noise are harder to compare and would need to be presented
and justified. Simple shifts include averaging over different bandwidths, varying the bandwidth that the noise is averaged, or varying the power level. Generally, varying the out of band rolloff (for 100BASE-T1L) shouldn’t be a substantial effect as this
could (and probably should) be excluded in an implementation by receiver filtering.
For those looking at the mixed crosstalk models, Tingting had asked about the sharp attenuation at 20 MHz for 10BASE-T1L in the figure on slide 11 of
https://www.ieee802.org/3/dg/public/May_2022/zimmerman_3dgah_01b_01292024.pdf, This is because the PSD for 10BASE-T1L is not defined beyond 20 MHz. By that point it has already rolled off below where it would be a factor in the calculation, and, real
PSDs would be far below the -70dBm/Hz level of the upper PSD mask… hence it doesn’t make sense to consider it a wideband source at that point.
Again, I would suggest you run results consistent with what others are doing/have done and anlso with what you think is right - that way we can calibrate results. If you anre going to another noise
model, I would suggest posting it to the reflector - that way we move to consensus. The actual transmit and disturber pads will be different yet, especially near the band edge and roll off region. We now have some presented results. I would suggest starting
with those noise scenarios for comparison.
I’ve been through the process of committees trying to reach consensus results and they are never perfect. Different simulation effects, different receiver models considered, different transmit psds
both for disturbers and victims, as well as external noise models tend to limit matching of results. From what I’ve seen if we get agreement and some understanding of differences within about 1db, that will be very good. Finer matching is usually not reflective
of general principles, but more about how the simulation is constructed. Matching worse than 2db (differences of more than 2db between individual presenters) is usually a suggestion that there is some factor they are not aligned on which needs to be resolved.
Between 1 and 2 db is a judgement call…. Again, these are my personal experiences having based on how this kind of work in standards group has gone in various projects both in ieee 802 and other groups (dsl from the 1990s).
As a result, starting from a common basis before making changes is important, and often the more important answers are not the absolute margins but the relative results of each evaluator.
I hope this helps you all as we move toward making some decisions in Denver.
George Zimmerman, Ph.D.
President & Principal
CME Consulting, Inc.
Experts in Advanced PHYsical Communications
310-920-3860
To unsubscribe from the STDS-802-3-SPEP2P list, click the following link:
https://listserv.ieee.org/cgi-bin/wa?SUBED1=STDS-802-3-SPEP2P&A=1
To unsubscribe from the STDS-802-3-SPEP2P list, click the following link:
https://listserv.ieee.org/cgi-bin/wa?SUBED1=STDS-802-3-SPEP2P&A=1
To unsubscribe from the STDS-802-3-SPEP2P list, click the following link:
https://listserv.ieee.org/cgi-bin/wa?SUBED1=STDS-802-3-SPEP2P&A=1
To unsubscribe from the STDS-802-3-SPEP2P list, click the following link:
https://listserv.ieee.org/cgi-bin/wa?SUBED1=STDS-802-3-SPEP2P&A=1
To unsubscribe from the STDS-802-3-SPEP2P list, click the following link: https://listserv.ieee.org/cgi-bin/wa?SUBED1=STDS-802-3-SPEP2P&A=1